How the stolen Coldcard Bitcoin is moving
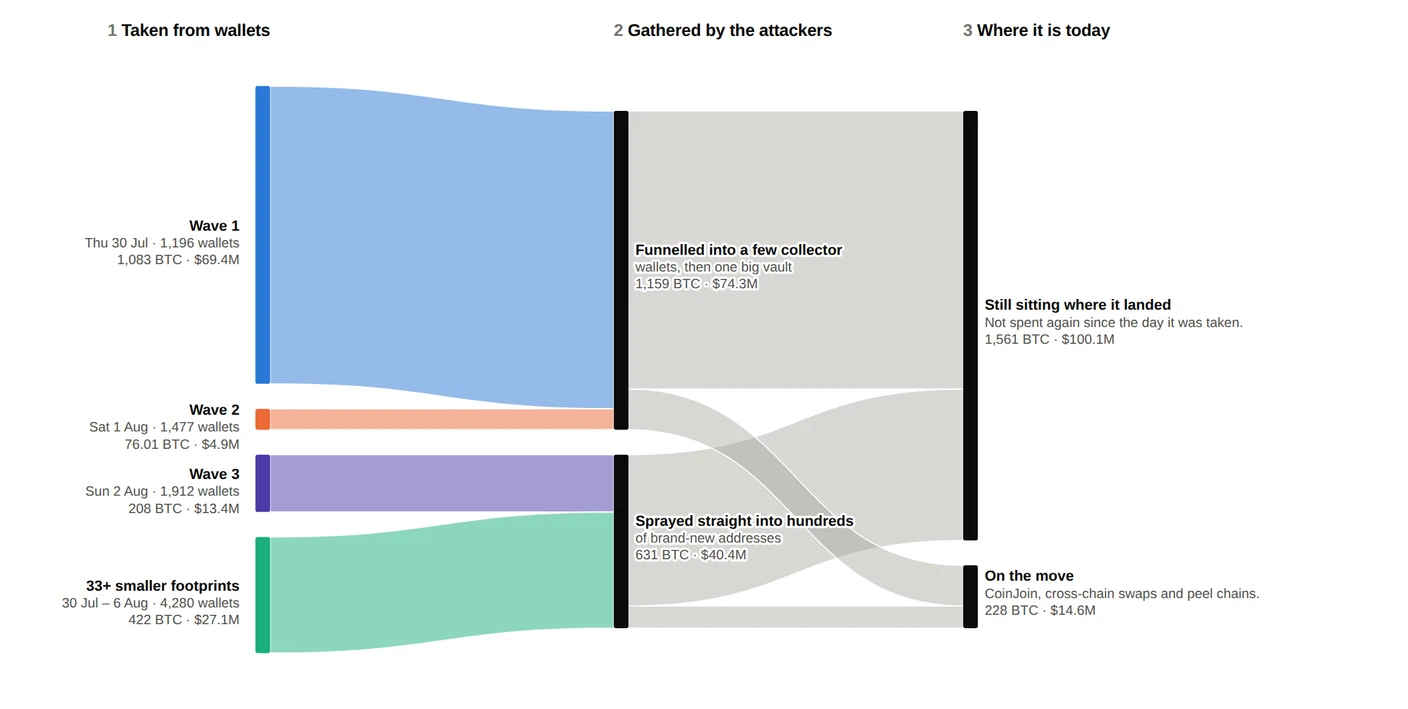
A firmware bug let anyone who noticed guess the keys to thousands of Coldcard wallets. Dozens of people did, over eight days in which about 1,789 BTC, roughly $115 million, was swept out of 8,865 addresses. Then, on 6 August, it stopped.
I built an interactive map of where it went, because for a long time the answer was: nowhere. Most hack graphics are a tangle of exchanges, mixers and peel chains. For five weeks this one was a river that flowed straight into a wall. Around 87% of the coins never moved after the day they were taken, sitting unspent in attacker addresses that everyone could see and nobody could touch.
That is the strange thing about stealing this much Bitcoin. Taking it was easy: the first wave emptied 1,196 wallets in forty-one minutes. Spending it is the hard part. Every attacker address is catalogued and fed to law enforcement, the exchanges and the compliance firms, so the big piles sit in plain sight, frozen not by any lock but by the watching.
Then, on 3 September, the first pile moved. The wave 3 operator ran about 20.5 BTC out of its vault, through a chain of hops, into THORChain, and swapped it for Ether. It did not go smoothly: the swaps kept getting refunded and retried, and the Ether that came out the far side landed on a fresh address that had already been shared with the authorities. The coins changed chains without shaking anyone off. It is the first real test of whether being watched actually stops someone from spending, and so far the answer is: it slows them down, but it does not stop them.
The map keeps up with all of it. It is built for people who do not read block explorers, and it prints cleanly if you want it on paper. Figures are Galaxy Research’s, and because this is a live incident, treat them as a snapshot rather than a final count.
Project page: https://nader.io/projects/coldcard-money-map